Quarter and report March 29, 2018
A positive quarter despite higher volatility
So often it is difficult to separate day to day market action and financial headlines from the big picture. The recently passed quarter was a perfect example. What we saw was a sudden return to a “normal“ market. When we speak of stocks, the sudden pop in volatility was shocking only by comparison to the placidity of last year‘s equity behavior. Historically a range of about 15% is normal for U.S. equities. We have been well below that figure for many years. This “Goldilocks” period appears to have ended.

As for Bonds, the Federal Reserve has stated amply that it would like to return to a more “normal balance sheet.” What this means is that the gobs of bonds that were purchased to keep interest rates artificially low during the recession and the ensuing difficult years are now being gradually sold off into the market, threatening excess supply. Were the market not ready for this readjustment back to more normal levels of bond holdings, interest rates would shoot northward. They have, in fact, risen quite a bit in the past year and a half, but remain near historic low levels.
As has been warned since early 2009, rising interest rates could snuff out economic expansion. It has been my opinion for some time that demographics are trumping supply worries when it comes to fixed income investments. Massive numbers of aging investors in the major economies are seeking stability and income either directly or through the purchase of annuity contracts. Further, because Europe has not yet begun adjusting back toward normal and because Japan too is seeking to keep its economy expanding, low interest rates in Japan and Europe make U.S. dollar- issued bonds, with their higher yields, a bargain. Recent equity market volatility only serves to remind retirees of the appeal of instruments guaranteeing income. Sustained demand for bonds is largely offsetting the forces that would otherwise drive interest rates still higher.
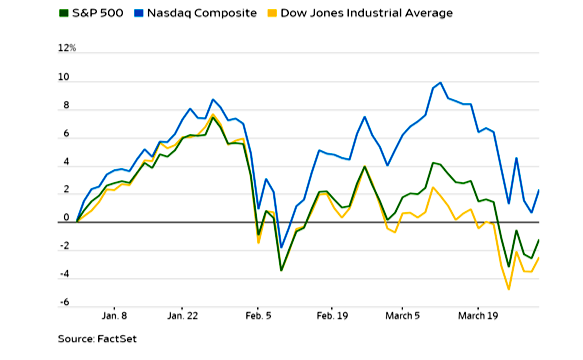
According to the Wall Street Journal “The S&P 500 fell 1.2% for its first quarterly loss since 2015, while the Dow Jones Industrial Average slipped 2.5% over the same period and the Nasdaq Composite rose 2.3%.” In other words, blue chip and large capitalization equities surrendered all their first quarter gains while the technology heavy NASDAQ index still rose at a rate that, if it continued, would produce a full year return of nearly 10%. This, despite devastating media attacks on Facebook and a largely ineffectual White House attack on Amazon.
Surprisingly, exchange traded funds (ETF) designed for cautious investors and loaded with shares of allegedly low volatility stocks, underperformed the broad index in the correction. As of this writing, it is unclear what drove this anomaly. It is possible that those seeking equity participation but with fewer bumps, are the same folks quickest to abandon stocks altogether, thus exacerbating the sell off among traditionally safer industry groups. For example, utilities, REIT’s and MLP’s, all high dividend payers were some of the worst performing sectors. In fact, due to their slump, we now look favorably on names within all three camps as value buying opportunities.
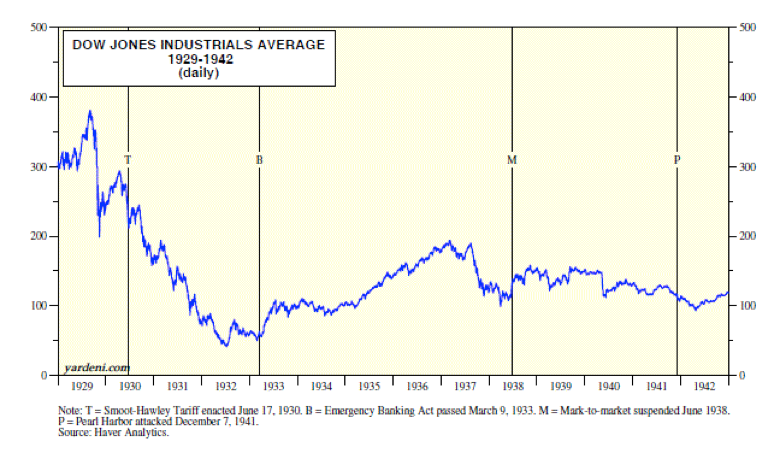
Although the quarter began strong, with investors throwing money at the market, especially technology companies, by mid-February things turned., Even with the recent correction plus some large intraday swings, leading technology stocks such as widely held Microsoft and Amazon posted gains. The Dow Jones Industrial Average, while down a bit, appears to be adjusting, but not entering a bear market. Much depends upon if and how a tariff war develops among trading nations. Students of the Great Depression are in general agreement that the tariff war initiated by the United States in 1932 deepened and prolonged the economic decline. The chart below shows what happened to the Dow after Smoot-Hawley tariff legislation was signed into law by president Hoover in 1930.

There are already indications that the Trump administration is moderating its aggressive stand on tariffs, having largely exempted major trading partners from proposed 25% steel import tariffs within days of their announcement. Despite the threat of a tariff war with China, even Boeing put in a strong quarter, up 8.51%, suggesting that behind the tough talk in public, back channel negotiations are underway, to allow the USA to sell more goods to China without their government losing face.
Yet other iconic Dow names were less fortunate: one of the most widely held stocks, General Electric, crashed by 21.6%, defensive Procter & Gamble was down over 14% and Exxon Mobil fell almost 13% despite a steady rise in oil prices. The weakness for energy related companies was a surprise. Clients will recall our significant exposure to energy in the early days of the shale and fracking boom. This exposure was trimmed in late 2015 and early 2016. The sector has oscillated since then. Currently, our client holdings in the energy space are very light apart from Enterprise Product Partners. Enterprise does not produce energy but transports and refines it. The stock rallied briefly during the quarter but then returned pretty much to its level at the end of 2017. While EPD has not been a very rewarding stock in terms of total return for the past couple of years, it continues to generate a generous dividend over 6%. It appears to be well managed and disciplined in its use of capital to steadily expand its dominance of U.S. energy infrastructure. We have now become the largest oil producer on the planet and an exporter, lending confidence in the earnings capacity of Enterprise Product Partners.
Technology names, despite a major setback toward the end of the quarter, still performed extremely well with Amazon, for example, up 22.4%. However over- loved Tesla was down 17.2% on fears that investors are becoming impatient with its rate of cash burn, challenge producing enough Model 3’s to compete in the lower priced market and fears of a coming onslaught of competing electric automobiles.
Overall, the equity market really did not surprise from this standpoint: considering the tremendous gains produced in 2017 it would have been logical to have relatively low expectations for 2018. What really changed was the level of volatility during the quarter and a reminder to complacent stock investors that portfolio diversification into other instruments dampens the effect of stock market corrections.
Many pundits are offering hopeful assessments for coming market sessions, citing the likelihood of strong earnings reports across a wide swath of industries. They also point to simultaneous economic expansion in Europe and Asia. It is doubtful that the correction of recent weeks has run its course. Investor psychology is a powerful factor in short- to-intermediate term market behavior. There is not yet enough fear among investors to lead to a “bottom.” While we are in a seasonally supportive period and could see a healthy reflex rally in the next few weeks, I suspect the market will back-and-fill through the summer, as sentiment deteriorates while resolving itself higher in the fall.
There may be another negative factor at play here as well: politics. Stock markets tend to anticipate events about 6 months in advance. Wall Streeters realize we are facing a midterm election in about six months and it is widely believed that Democrats will gain seats at the expense of Republicans. While history does not prove that Democrats are bad for business, there is a wide fear among capitalists that they are. If Democrats take control of at least one branch of Congress, they could stymie proposed rollbacks of bank regulation and hated environmental and land use restrictions. Further, impeachment proceedings could add uncertainty to an already unpredictable executive branch and uncertainty is not usually something markets appreciate.
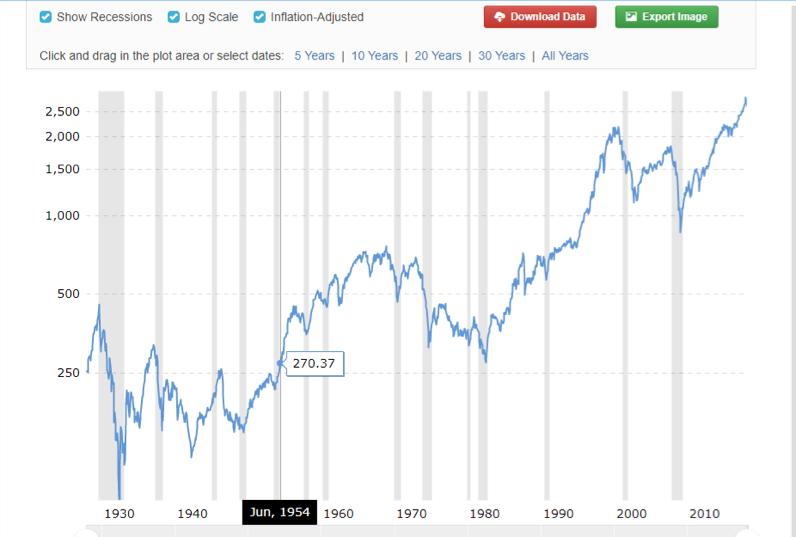
On a positive note, consider this long-term chart of U.S. stocks, which includes the Great Depression and the period illustrated above, but is updated to current times and adjusted for inflation:

Note to the right that markets breached a previous high in about 2015 and have advanced to record highs since. This is similar to what was witnessed in 1954 and again in 1992. This graph suggests we are amid a secular bull market for stocks, like that seen in the 1950’s and again in the 1990’s. Such movements are not usually reversed by one or two quarters of slowing economic growth or politically driven disruption. This graph offers reasons to be optimistic.
Gary Miller, CFP
Chief Investment Officer
